Dashboards provide at-a-glance overviews of your work. Instead of navigating into individual boards to see what needs attention, dashboards aggregate information and present it in a summarised format. Kanodo offers two types of dashboards: workspace dashboards for individual workspaces and the workspaces dashboard for an overview across all workspaces.
Understanding dashboards
Dashboards are designed to answer questions like:
- What has been happening recently in this workspace?
- What tasks are coming up or overdue?
- How is work distributed across my boards?
- Which areas need attention?
Rather than being a place to do work, dashboards are a place to understand the state of your work and decide where to focus.
Workspace dashboard
When you select a workspace (without selecting a specific board), you see the workspace dashboard. This provides an overview of activity and statistics within that single workspace.
Accessing the workspace dashboard
Click on a workspace name in the sidebar. If workspace dashboards are enabled (the default), you see the dashboard view. From here, you can click on any board in the sidebar to view that board directly.
Dashboard widgets
The workspace dashboard consists of several widgets, each showing different information. You can customise which widgets are visible in Settings.
Statistics widget
The statistics widget shows key numbers for the workspace at a glance.
Metrics shown:
- Total cards: How many cards exist across all boards in the workspace
- Mini-cards completed: How many mini-cards have been marked complete
- Total mini-cards: The total number of mini-cards
- Active items: Cards that have been modified recently (typically within the last 7 days)
These numbers help you understand the scope of work and level of activity in the workspace.
Boards widget
The boards widget lists all boards in the workspace with summary information.
For each board, you see:
- Board name
- Number of cards
- Number of mini-cards and how many are complete
This helps you quickly see which boards have the most content and where work is concentrated.
Interaction: Click on a board to navigate directly to it.
Activity widget
The activity widget shows recently changed or created cards.
Two views
The activity widget offers two views that you can toggle between:
- Recently Modified: Cards that have been updated recently
- Recently Created: Cards that were created recently
Information shown
Each activity entry shows:
- Card name
- Which column the card is in
- When the change occurred (relative time like "2 hours ago")
Limit
The activity widget shows a limited number of recent items (typically 15) to keep the view concise.
Interaction: Click on a card to open its details.
Schedule widget
The schedule widget displays cards that have dates set, organised chronologically.
Date filters
The schedule widget can be filtered by date type:
- All: Shows all dated cards
- Overdue: Shows only cards with due dates that have passed
- This Week: Shows cards with dates falling within the current week
- Coming Up: Shows cards starting soon
- Due: Shows cards with due dates approaching
- No Dates: Shows cards without any dates set
Information shown
Each schedule entry shows:
- Card name
- Relevant date
- Board and column context
Overdue highlighting
Cards that are overdue are visually highlighted, making them easy to spot.
Interaction: Click on a card to open its details. Click date filter options to change what is shown.
Card distribution widgets
Two widgets show how cards are distributed across your workspace.
Distribution by column
This widget shows a visual breakdown of how many cards are in each column across all boards.
This helps you see if work is piling up in certain stages. For example, if many cards are in "In Progress" columns, you might have too much work in flight.
Distribution by label
This widget shows how cards are distributed by label.
This helps you understand the composition of your work. For example, you might see that most cards are labelled "Bug", indicating a backlog of issues to address.
Workspaces dashboard
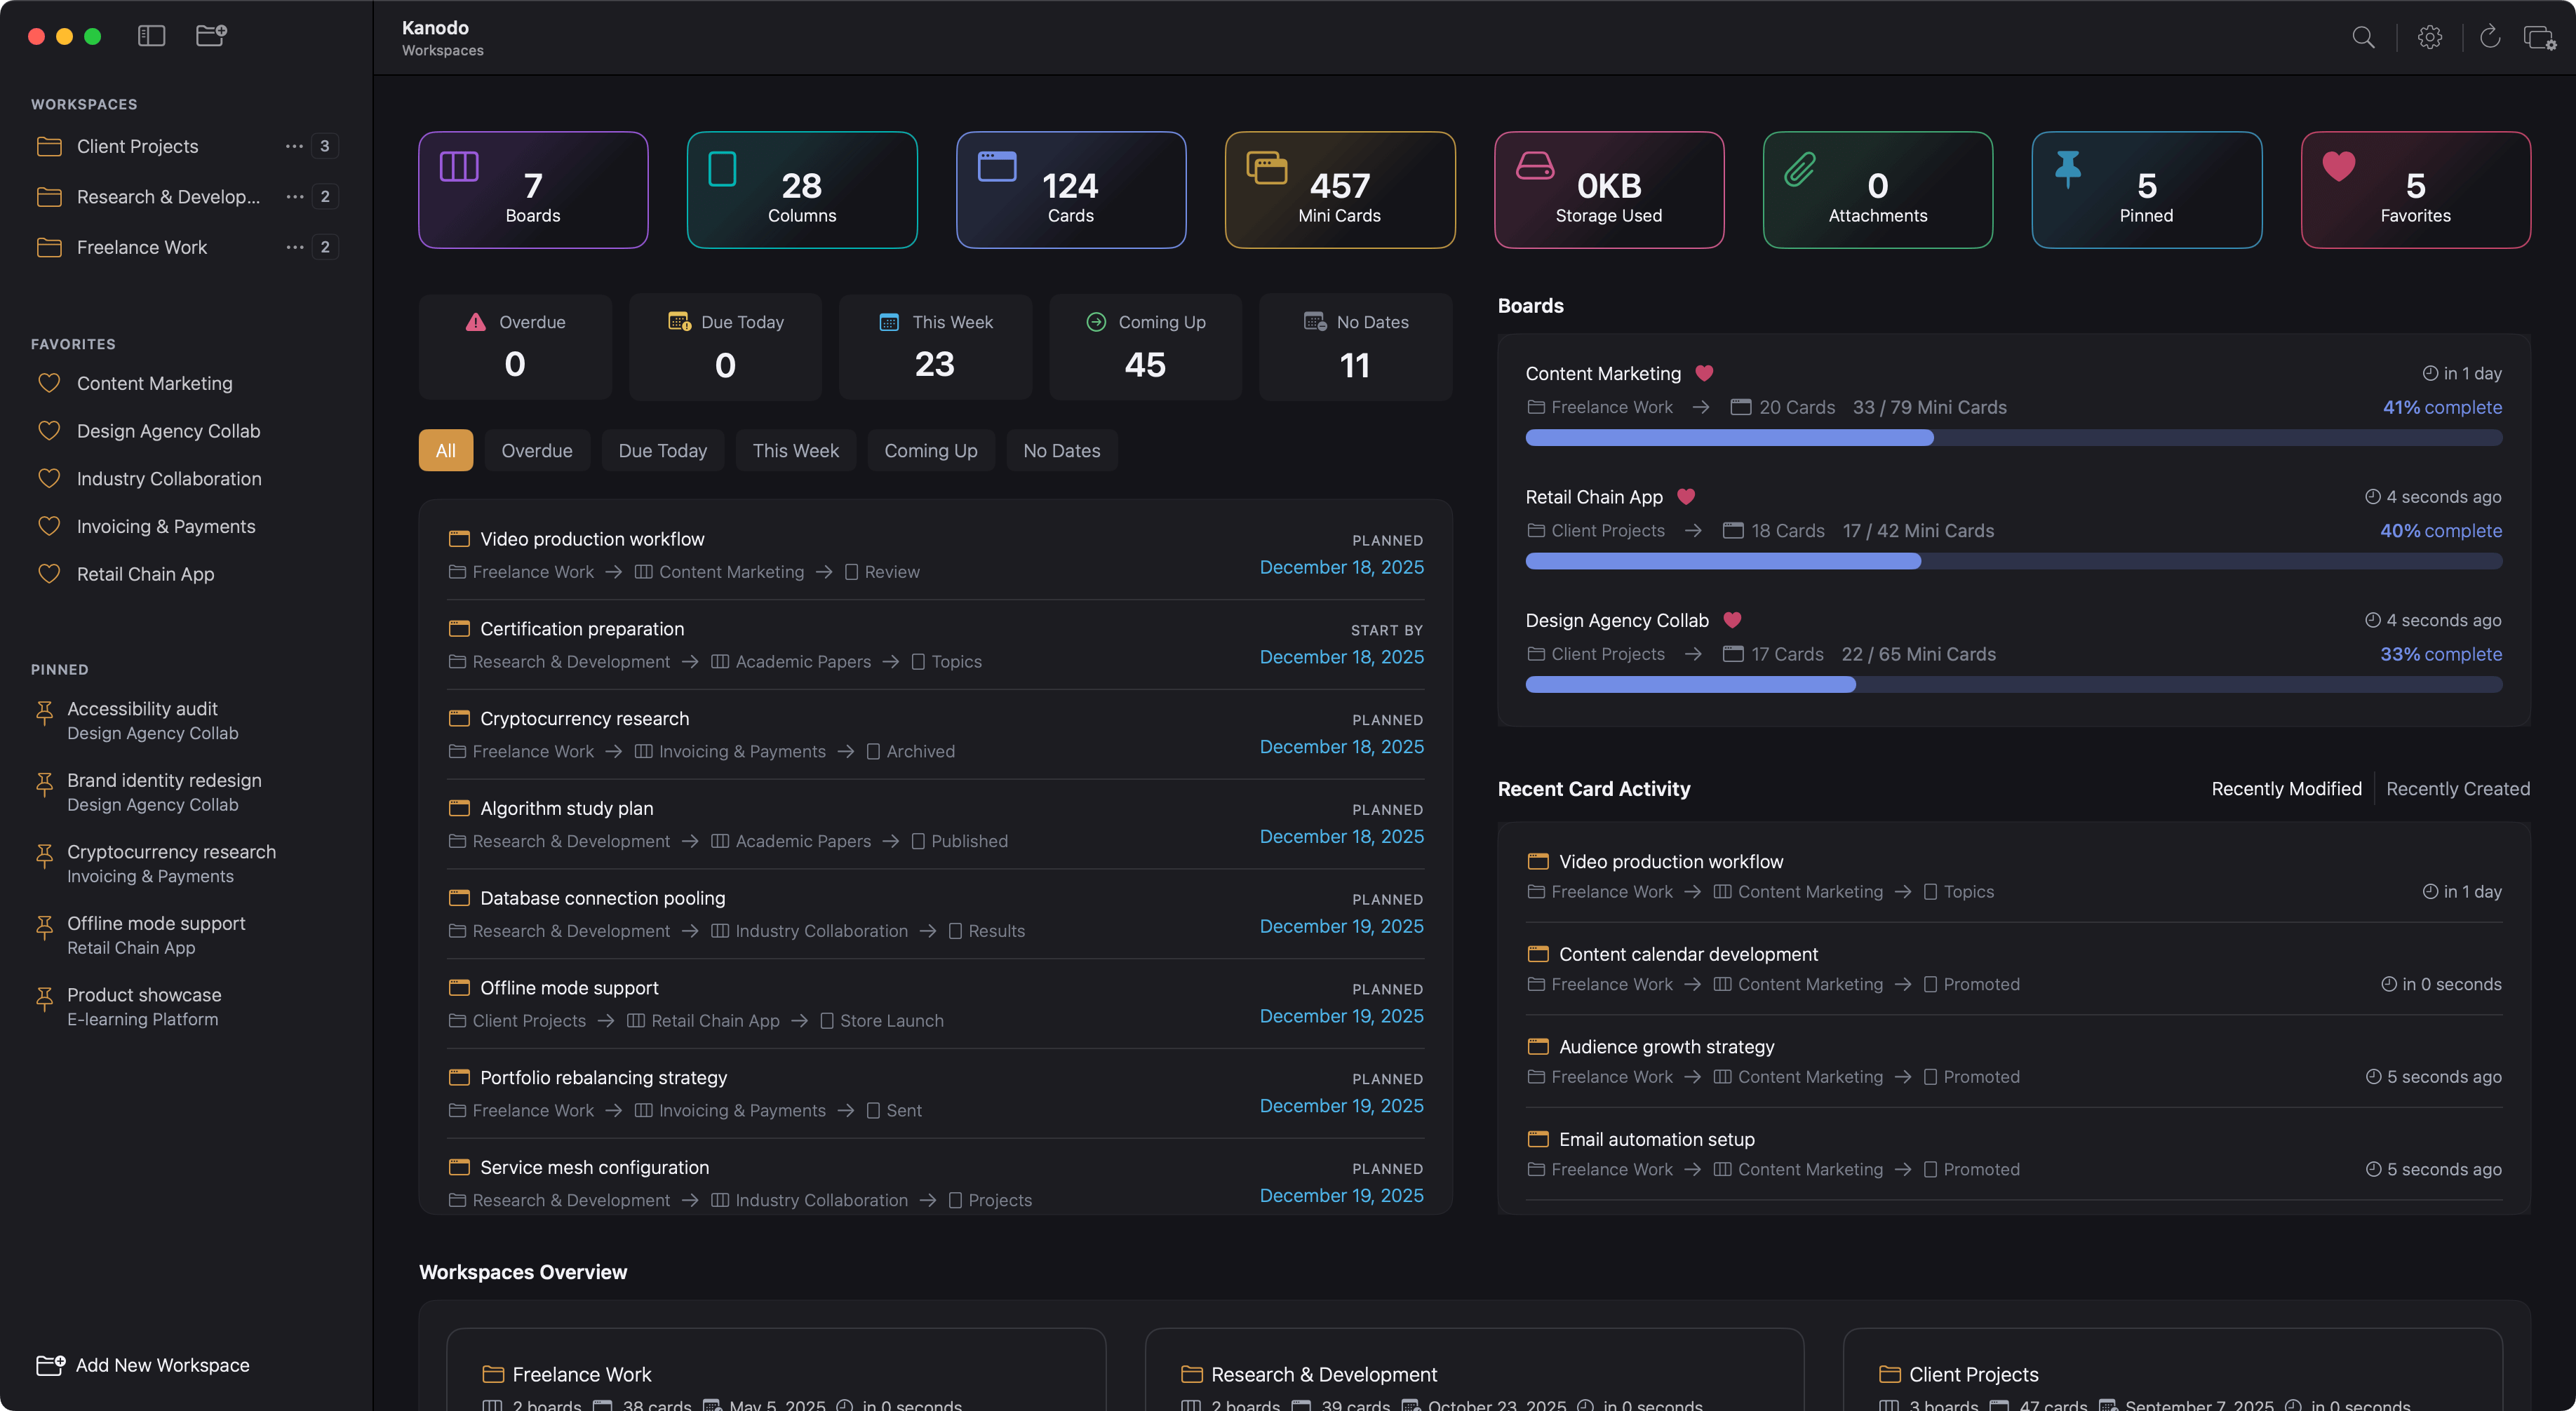
When you are at the top level (not inside any specific workspace), you can see the workspaces dashboard. This provides an overview across all your workspaces.
Accessing the workspaces dashboard
Navigate to the top level by clicking the back button in the sidebar until you see all workspaces listed. If the workspaces dashboard is enabled, you see the aggregated overview.
Workspaces grid
In addition to the standard widgets, the workspaces dashboard includes a grid showing all your workspaces with quick statistics for each. This provides a bird's eye view of everything you are tracking in Kanodo.
Interaction: Click on a workspace to navigate into it.
Aggregated data
The workspaces dashboard shows similar widgets to the workspace dashboard, but with data aggregated across all workspaces. Activity shows recent changes from any workspace. The schedule shows dated cards from everywhere.
Customising dashboards
You can control which widgets appear on your dashboards through Settings.
Workspace dashboard widgets
In Settings, find the dashboard settings for workspace dashboards. You can toggle:
- Statistics widget
- Boards widget
- Activity widget
- Schedule widget
- Card distribution by column
- Card distribution by label
Disable widgets you do not use to create a cleaner, more focused dashboard.
Workspaces dashboard widgets
Similarly, you can customise the workspaces dashboard with options for:
- Statistics widget
- Boards widget
- Activity widget
- Schedule widget
- Workspaces grid
Disabling dashboards entirely
If you prefer not to use dashboards at all, you can disable them in Settings. When disabled:
- Selecting a workspace shows a simpler view prompting you to choose a board
- Selecting the top level shows a view prompting you to choose a workspace
This is useful if you prefer to navigate directly to boards without the dashboard intermediary.
Using dashboards effectively
Daily review
Dashboards are excellent for daily or weekly reviews. Glance at the schedule widget to see what is due. Check the activity widget to recall what you were working on. Review distribution to spot imbalances.
Finding what needs attention
The overdue filter in the schedule widget quickly shows tasks that have slipped. High card counts in early workflow stages might indicate a backlog forming.
Understanding capacity
Distribution widgets help you understand workload. If certain labels or columns are consistently overwhelmed, you might need to adjust how you accept or prioritise work.
Quick navigation
Dashboards provide convenient navigation. Rather than remembering which board contains what, click through the dashboard to find and access items.
Dashboard performance
Dashboard data is calculated when you view the dashboard. For workspaces with many cards, there may be a brief loading period as data is aggregated. The dashboard shows a loading indicator during this time.
Once loaded, the dashboard reflects the current state of your data. If you make changes (like completing cards) and return to the dashboard, it shows the updated information.
